
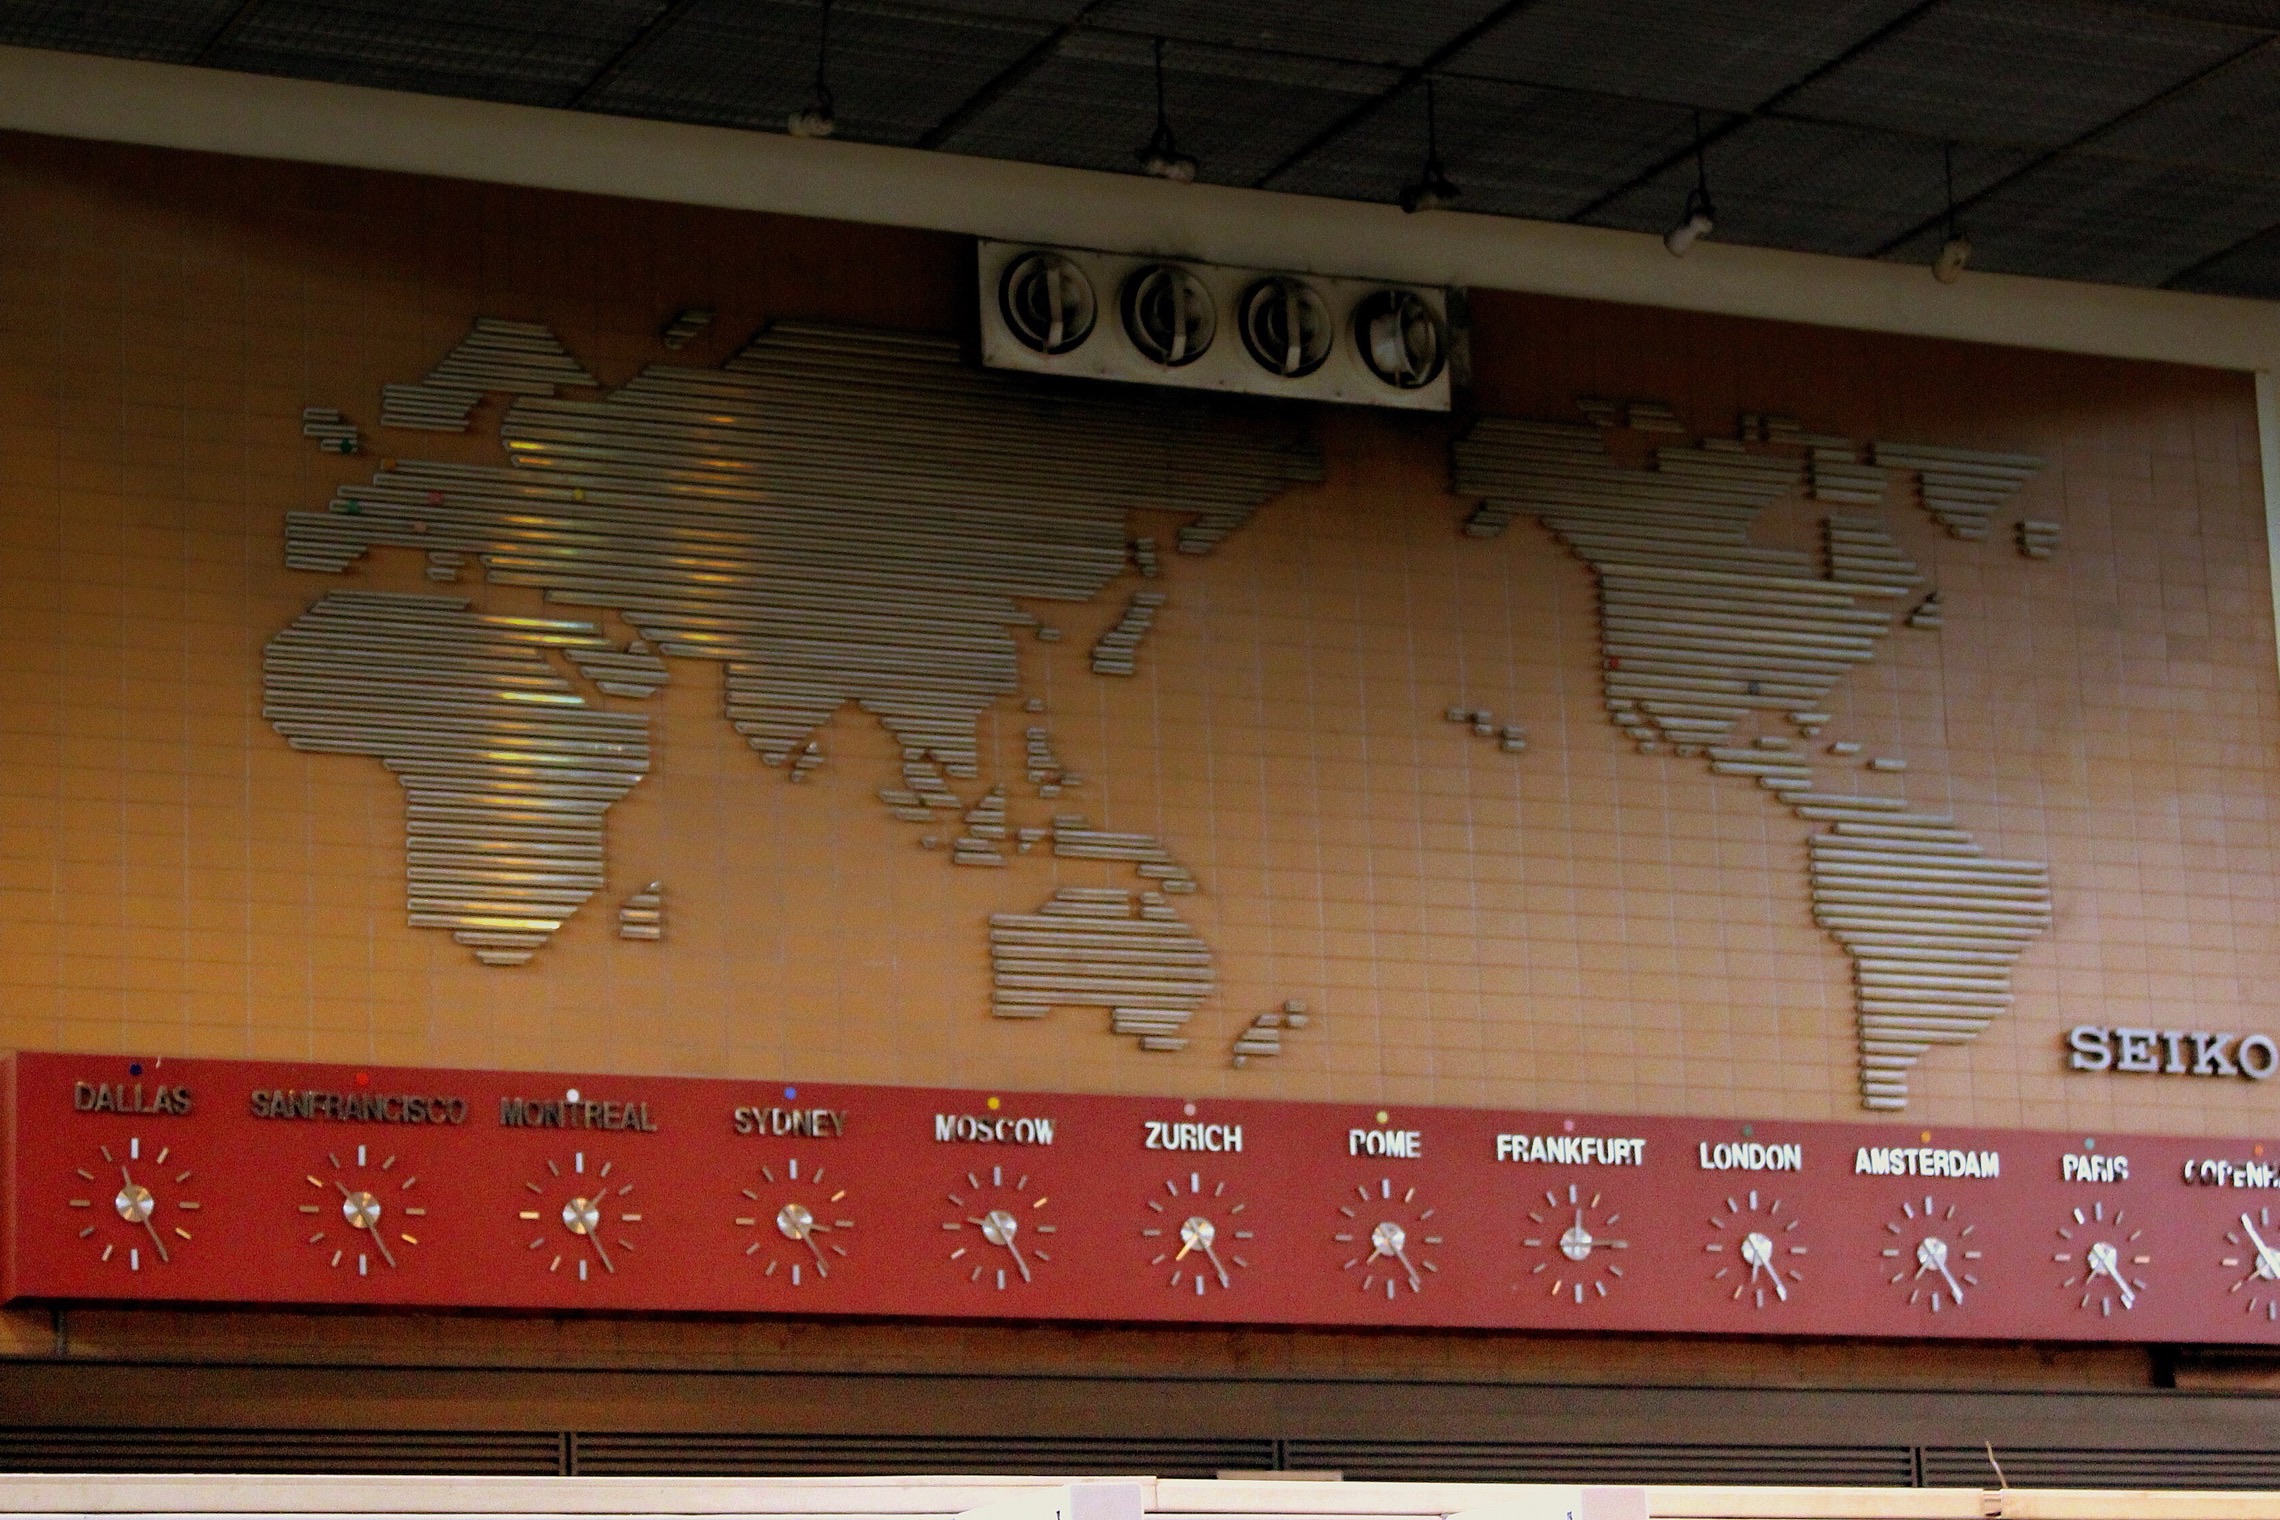
You look at the daily chart of one asset on two platforms and the candles do not match. The last one is green on one and red on the other. The data can be correct on both. What differs is where the day ends.
A candle is a box, not a measurement
A candle is not something that exists in the market. It is the trades in a given interval reduced to an open, a high, a low and a close.
What draws the boundary of that interval is a choice. For a daily candle, where does the day begin? Wherever the platform’s time zone says it does.
Crypto markets run around the clock, so there is no natural close. Most exchanges use midnight UTC; some platforms use the viewer’s local time. For someone in Istanbul the day ends three hours before UTC does, and that three-hour shift changes the candle’s high and low.
What the shift magnifies
Three hours sounds small. The consequences are not.
When a sharp move lands near midnight, one arrangement keeps it inside a single candle while the other splits it across two. Contained, it produces one long-bodied candle; split, it produces two medium ones, and the story the chart tells changes.
That reaches every approach built on candle patterns. A pattern visible on one platform simply does not form on another whose close sits three hours away.
Indicators depend on the close too
The difference is not only visual. Every indicator taking the closing price as input depends on when the close happens.
A moving average sums daily closes; shift the close and the average shifts with it. The same applies to anything working from close-to-close changes. The same indicator with the same parameters on two platforms can produce different values, and neither is wrong.
The practical consequence: which close definition produced a signal is information as important as the signal.
Equities add another layer
In crypto the issue is a choice of time zone. In equities there is a real session on top of that.
The exchange has opening and closing times, and trading can happen outside them. Whether the daily candle includes out-of-hours trades varies by platform. Include them and opening gaps disappear; exclude them and gaps open up between candles.
If you read exchanges in several countries in one table, daylight saving enters as well. The offset between two exchanges changes for part of the year, and in a table that assumes aligned dates that change turns quietly into a one-day shift.
What to do
Three rules keep the difference manageable.
Pick one close definition and use it everywhere. Which time zone you work in is a decision that comes before the indicator and before the strategy.
Make the backtest and the live run share a close. When the backtest uses the UTC close and the bot runs on a local one, the strategy you tested is not the strategy that is running.
Write the time zone next to any chart you share. The candle in your screenshot may not be the same candle on the other person’s screen, and the difference only surfaces when someone asks.

.jpg)