If you watch a portfolio across two exchanges, sooner or later you’ll see it: the same asset, at the same moment, at two different prices. Sometimes a tenth of a percent, sometimes a full percent.
The first reading is usually “one of them is wrong”. Neither is. There’s no single correct price to be wrong about.
There’s no single price, there’s a book
The price on an exchange is the price of the last trade that happened on that exchange. That trade occurred between a buyer and a seller in that exchange’s own order book.
So there is no central value called “the price of Bitcoin”; every exchange has its own book and its own last trade. The single number you see quoted on data sites isn’t a fact either; it’s an average across several exchanges, and it changes with which venues are included and how they’re weighted.
Something similar applies to equities: a share traded on more than one venue won’t line up exactly once currency and session hours enter the picture.
What widens the gap
The size of the gap isn’t random. A few things drive it.
Liquidity. The thinner the book, the more a single trade moves the price. Comparing a high-volume exchange with a small one, most of the difference comes from here.
Local demand. On an exchange serving a particular country or currency, region-specific demand can hold the price persistently above or below elsewhere. That kind of gap sometimes doesn’t close for weeks.
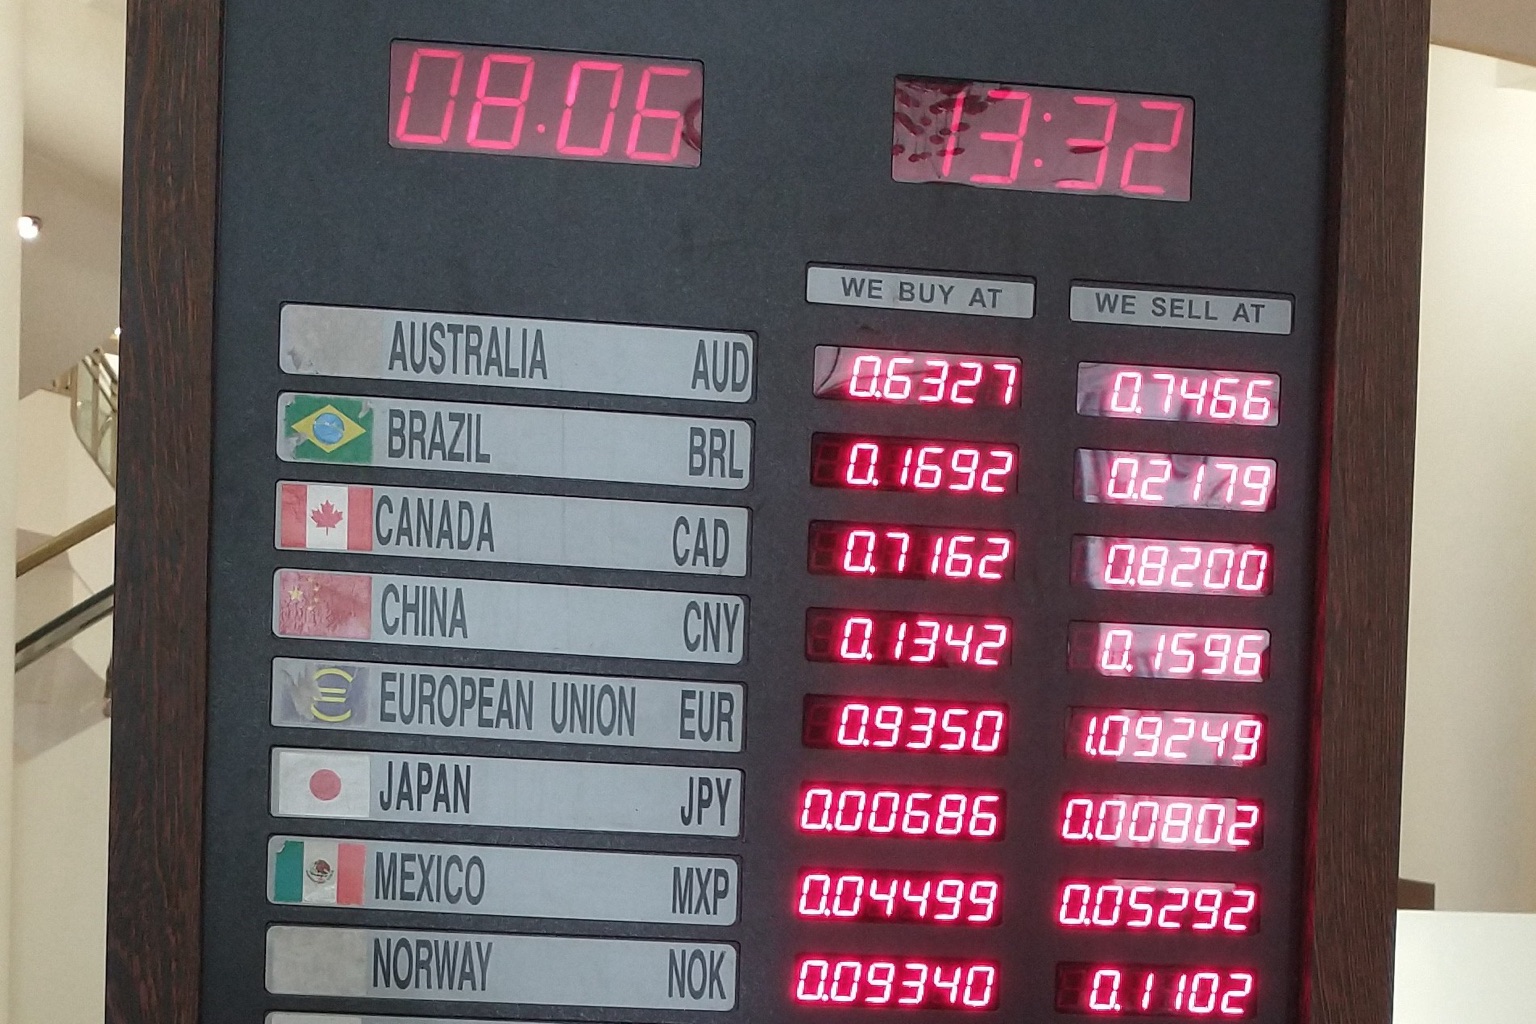
Quote currency. If you’re comparing pairs quoted in different currencies, part of what you’re seeing isn’t a difference in the asset. It’s a difference in the exchange rate.
Moments of volatility. During sharp moves, exchanges don’t react at the same speed. The gap opens within seconds and usually narrows within seconds too.
Why the gap on screen can’t be taken
Everyone who notices the difference has the same first thought: buy on the cheap one, move it to the expensive one, keep the difference. The idea is correct as a description and almost never produces the gap you saw on screen.
What sits in between: trading fees on both sides, the withdrawal fee, the time the transfer takes to complete, and orders filling at the price available in the book rather than the price you were looking at. When a transfer takes minutes, you arrive at the end of those minutes to find a gap that has closed, having paid the fees anyway.
There’s an invisible part too. If funds are already waiting on both exchanges the transfer time disappears, but now part of your capital is permanently parked in two places. That’s also a cost; it just doesn’t appear on a statement.
When a gap looks large and persistent, the reason is usually a constraint rather than an opportunity: withdrawals halted on that venue, transfers restricted in that region, or a book that really is that thin.
What to do with this
The practical takeaway isn’t a trading strategy. It’s a reading habit.
When you value a portfolio, know which exchange’s price you’re using and keep it fixed. If your total moves by a percent or two on every refresh, the cause may be mixed sources rather than the market.
And when you buy or sell, your reference shouldn’t be the blended average. It should be the book of the exchange you’re trading on. The average price is news. The price you’ll pay is written in that book.
In Finbula, when crypto and equity positions are read in one table, the source behind each row stays visible. Knowing where a difference comes from is more useful than the difference itself.